A History of the County of Middlesex: Volume 10, Hackney. Originally published by Victoria County History, London, 1995.
This free content was digitised by double rekeying. All rights reserved.
'Hackney: Building after c.1800', in A History of the County of Middlesex: Volume 10, Hackney, (London, 1995) pp. 14-18. British History Online https://www.british-history.ac.uk/vch/middx/vol10/pp14-18 [accessed 8 May 2024]
BUILDING AFTER c. 1800.
Despite the closeness of Church Street to Lower Clapton and Homerton, the villages were still distinct in 1801, when there were 2,050 inhabited houses. By 1831 the number had doubled and the villages were merging along the old roads. Infilling with new roads started in the 1820s at De Beauvoir Town, slackened a little in the 1830s, and thereafter gathered pace. (fn. 1)
The late 18th century had seen only isolated instances of speculative building, notably Sanford's cottages and Hackney Terrace. (fn. 2) More widespread changes depended on the major landowners, most of them absentees. An Act of 1796 for the sale of William Parker Hamond's estate had assisted the extension of Hackney village (fn. 3) but neither that nor an Act of 1808 for Nathaniel Lee Acton (fn. 4) led to more than building along existing roads; brickearth could be dug from the land behind, which was to be left fit for a return to agriculture. (fn. 5)
Systematic development was pioneered by the Rhodes family, whose members were not established landowners but enterprising lessees. They were active in several parishes (fn. 6) and acquired land on both sides of the Regent's canal, whose construction itself stimulated the spread of building from London's east end. In a Bill of 1823 the Rhodeses proposed the erection of a new town which, to the alarm of both Hackney and Shoreditch, would be rated as a separate district. (fn. 7) Although their first activity was halted, work at De Beauvoir Town was resumed in the 1830s for their landlord. Meanwhile Thomas and William Rhodes began to build east of Kingsland Road, largely in cooperation with Acton's heir Sir William Middleton. (fn. 8) 'Vast changes' had taken place across southern Hackney by 1843, where plots straddled a parish boundary which in 1803 had been clearly shown by field lines. (fn. 9)
Building accelerated, until Hackney had 9,027 inhabited houses by 1851, 12,352 by 1861, and 17,791 by 1871. (fn. 10) Landowners' cooperation was most visible east of Kingsland Road, between the boundary and Dalston, where long avenues formed a rough grid pattern. (fn. 11) Agreements were also made for tracts east of Mare Street, where the opening of Victoria Park in 1845 encouraged St. Thomas's hospital to progress to wholesale development, in conjunction with the Cass foundation and the Norris family. (fn. 12) Speculators appeared, in emulation of the Rhodeses: among them was the native John Musgrove and outsiders such as William Bradshaw and the partners Wilkinson and Matthews. They bought land piecemeal and tended to build to a lower standard than did contractors on the older estates. Southern Hackney, from the boundary to Dalston, Hackney village, and Homerton, had been almost entirely built up by 1870. (fn. 13) Clapton had also grown, forming with Hackney and Dalston 'one of the handsomest suburbs of London' in 1862. (fn. 14)
Cheaper housing transformed the social character of most of Hackney. Demolition was often deplored, as in 1832; it was blamed on a 'shopocracy' c. 1875. (fn. 15) From 1847 railways both took the grounds of old houses and created barriers across short streets which soon became slums. The vestry in 1864 vainly opposed all further railway schemes, fearing in particular for Hackney Downs. (fn. 16) Meanwhile industry made increasing use of the waterways. Factories, at Hackney Wick and Homerton, and the establishment of institutions for the poor, were causing the better off to move and opening the way for crowded terraces at Lower Clapton.
The 1860s and 1870s saw building across the centre of the parish, on estates such as the Massies' at Dalston, the Powells' at Clapton, and the Glyns' at Homerton. The large Tyssen-Amhurst holdings (fn. 17) were also developed, with sales of commercial premises, notably along the high road, (fn. 18) and the laying out of long residential roads around Hackney Downs and to the north. The Downs and other threatened common lands were preserved from 1872 and the marsh from 1893, (fn. 19) when other available land in southern Hackney had been rilled. Inhabited houses numbered 23,934 in 1881 and 28,422 in 1891, (fn. 20) by which time roads had been planned over most of the north part, on both sides of Stamford Hill. Spacious private grounds survived only between Clapton common and the Lea, (fn. 21) where the creation of Springfield park in 1905 was followed by the spread of housing to the north.
Change continued, under pressure from London's east end. As public transport enabled clerks and artisans to move in, the old main roads grew noisier, large houses were converted or subdivided, and the better-off retreated northward. In the 1880s most of Hackney was middleor lower middle-class (fn. 22) but many led 'pinched' lives and in 1897-8 the parish was seen to have been growing poorer over half a century. The trend had been uneven, as London businessmen remained in Upper Clapton and more had moved to Stamford Hill. Poverty existed mainly east of Mare Street and Clapton Road, but had also spread north across the canal to London Fields. The poor combined footwear makers from Bethnal Green with Hackney's indigenous poor off Homerton's high street and those drawn by low rents to Hackney Wick; while there had been some improvement in behaviour at Homerton, cheap housing was creating 'a dismal but not a rowdy district' near South Mill field at Lower Clapton. (fn. 23) The social decline of the neighbourhood was perhaps modified by the scattered building of private blocks of flats from the 1890s but it was to continue in nearly all parts, assisted by laxly controlled conversions in residential streets and the provision of council housing.
Hackney had been covered by the Metropolitan Building Act, 1844, which lack of inspection made relatively ineffective, and with Chelsea had led the enforcement of the Sanitary Act, 1866, against landlords. (fn. 24) The death rate then compared favourably with London's average. (fn. 25) While riverside cottages and some alleys remained unhealthy until their clearance after the First World War, the main patches of poverty c. 1890 were relatively small, around the factories at London Fields, Homerton, and Hackney Wick. In 1902 only 23.1 per cent of Hackney's population was in total poverty, little more than half the proportion in Bethnal Green. (fn. 26) Comparatively favourable statistics, however, hid differences between the northern and southern halves of the new metropolitan borough, whose overall population density was kept low by the existence of the commons and Hackney marsh. Overcrowding grew worse between 1901 and 1911, partly as a result of Jewish immigration, and made necessary the municipal estates which were to produce a predominantly working-class suburb.
The parish was noted throughout the 19th century for its many charitable institutions, either national or connected with London. (fn. 27) The general provision of model dwellings, a philanthropic cause from the 1840s, followed only after the south part had been built up and in the wake of schemes for the middle class, such as those of the St. Pancras, Marylebone and Paddington Freehold Land Society or the Suburban Villa and Village Association in the 1850s. (fn. 28) Housing in Chapel Road was leased to the London Labourers' Dwellings Co. in 1866 and land at Baker's Hill to the London Labourers' Association in 1878. (fn. 29) Seeking cheaper land in the suburbs, the Metropolitan Association for Improving the Dwellings of the Industrious Classes built artisans' flats at Gibson Gardens in 1880. (fn. 30) The Four Per Cent Industrial Dwellings Co. (in 1951 renamed the Industrial Dwellings Society) similarly looked farther afield; originally for rehousing Jews in the East End, it had flats in Stoke Newington from 1903 and opened Hackney's Navarino Mansions in 1905. (fn. 31)
Public provision, prompted by slum clearance, was first made by the L.C.C., whose Darcy and Valette Buildings, opened in 1904 and 1905, together contained 120 dwellings. It was resumed in 1928-30 with the Shore estate, followed from 1931 by work at Stamford Hill, and by 1938 on five other estates, the largest being Northwold. (fn. 32) Meanwhile Hackney council in 1925 had started to build 48 maisonettes in Fletching Road; they were followed in 1930 by 92 in Southwold Road, by a few conversions of older houses, and by estates of which the largest were Powell House and Banister House. By 1939 Hackney owned 13 estates, mostly smaller than the L.C.C.'s, and hoped soon to have met all reasonable housing demands. (fn. 33) Between the World Wars 5,189 dwellings of all types were provided by the L.C.C. and 2,780 by the borough. (fn. 34)
Hackney between the wars was chiefly a dormitory: 53 per cent of the working residents travelled to the City or neighbouring boroughs in 1921. Only one person in five, mostly in Upper Clapton or Stamford Hill, was middleclass c. 1930, when both birth and death rates were about the average for an east London borough. Overcrowding in the south part was 'not pronounced', (fn. 35) perhaps because of rehousing and because of the falling population, itself attributed to a continued displacement of houses by factories and workshops. (fn. 36) The 1930s, with their widespread council building, brought more housing by charities, notably the Samuel Lewis trust, already active in Dalston, the Guinness trust, and the Four Per Cent Industrial Dwellings Co. (fn. 37) Bethnal Green and East London housing association was a builder in Devonshire Road in 1931 (fn. 38) and Shoreditch housing association bought property in Loddiges Road in 1937. (fn. 39) In general plans by the L.C.C. to control the spread of commercial and industrial zones were too weak for the borough council but alarming to landowners. (fn. 40) The Cass trustees wanted their estate to be 'residential' rather than 'special residential', in order to build flats, and opposed any reduction in the housing density. (fn. 41) The Tyssen trustees, finding many large houses in less demand, in 1932 felt justified in letting for 'trade purposes of a more or less private character', notably dressmaking. (fn. 42)
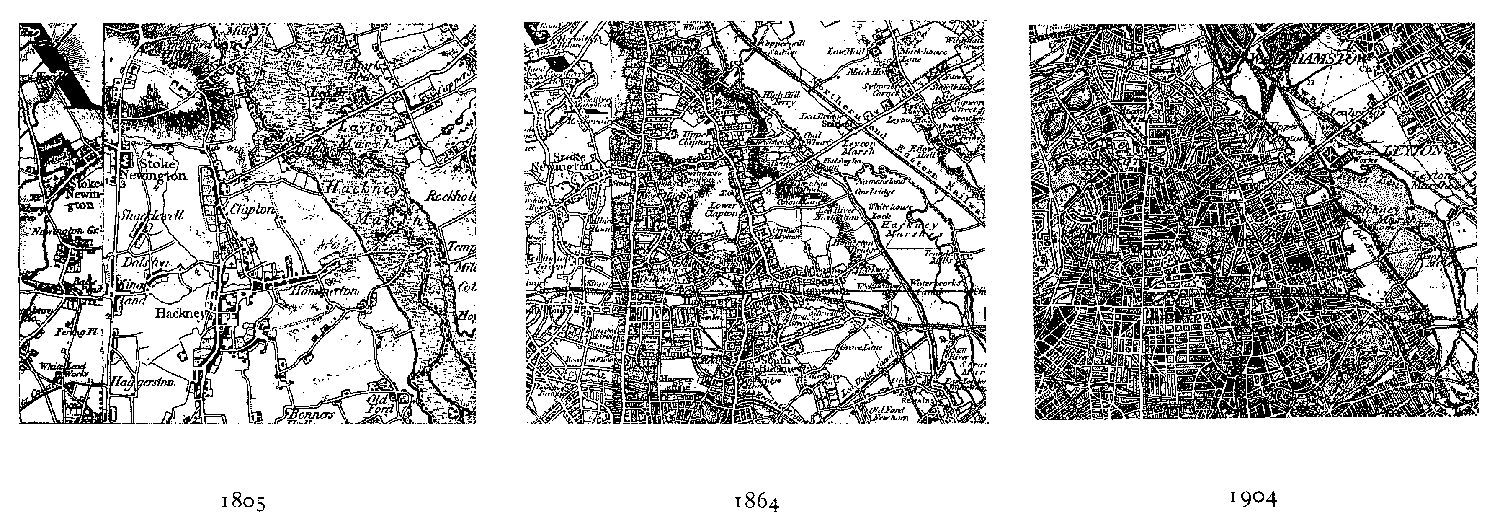
Hackney: Evolution of Settlement, 1805-1904
(scale 1 in. to 1 mile)
Widespread damage in the Second World War (fn. 43) led to more municipal building. Post-war activity accounted for 4,891 new dwellings in 1957, of which the borough provided 2,816, the L.C.C. 1,772 and a further 33 in conjunction with housing associations, and private builders 270. (fn. 44) In 1967 the borough owned a total of 17,063 permanent dwellings and the G.L.C. 12,475; in addition there were nearly 5,000 temporary dwellings. (fn. 45) Hackney had complained in the war about plans by the L.C.C. for tower blocks, since it had more than enough buildings of five or six floors. (fn. 46) Lack of space nonetheless led to high-rise construction, of which elevenand fifteen-storeyed examples were quoted in 1960; towers of up to twenty-one storeys followed. (fn. 47) Transfers from the G.L.C. to the London Borough were first proposed in 1969. (fn. 48)
The new London Borough had a reduced waiting list of 10,000 persons in 1973 and a stock of 41,000 dwellings in 1992. (fn. 49) The decay of older blocks and fears for the safety of towers built in the 19605 led to demolition and extensive renovation in the 1980s. (fn. 50) The previous 20 years had seen an increase in council housing and, to a lesser extent, in owner occupancy, at the expense of private rented accommodation. (fn. 51) Building and conversion were also being undertaken, with government help through the Housing Corporation, by housing trusts. Newlon and Circle Thirty Three housing trusts, both founded in 1968 and concerned chiefly with north-east London, were active in 1992. (fn. 52) When the Salvation Army's Mothers' hospital closed, it was Newlon trust which redeveloped much of the site as Mothers' Square. (fn. 53) Private building, restricted in the 1970s to modest infilling, also gathered pace. (fn. 54)
In 1981 Hackney L.B.'s highest concentrations of council housing and of owner occupiers were outside the former parish, respectively in Shoreditch and Stoke Newington. (fn. 55) The widest variations, however, existed in the 15 wards (fn. 56) which covered the former Hackney metropolitan borough. King's Park, stretching from Homerton Road to Lea bridge, had 94.9 per cent of its households in council housing; Queensbridge had the next highest, 77.1 per cent, another six wards had over half, and Homerton had the lowest, 24.2. Homerton included much of the older Clapton Park and had the highest percentage of owner occupiers, 42.7; a further 23.9 per cent of its households was in private rented accommodation, which category accounted for as many as 29.7 per cent in Northfield west of Stamford Hill. Housing associations accounted for more than 17.5 per cent only in Westdown, around Kingsland High Street and Colvestone Crescent, where ownership was relatively evenly distributed between the council with 27.3 per cent, housing associations with 26.3, private landlords with 29.1, and occupiers with 15.6. Owner occupancy was not everywhere a sign of prosperity; many owners were immigrants, who lacked the residential qualifications for council housing and had difficulty in carrying out repairs. (fn. 57)
Ethnic minorities increased, while the population fell. Jews, the most clearly differentiated newcomers in the late 19th century, tended to move northward and after 1945, with orthodox reinforcements, were most prominent around Stamford Hill. (fn. 58) From the 1950s immigrants came mainly from the new Commonwealth: by 1972 children of West Indian origin were numerous at St. John of Jerusalem's primary school and Afro-Caribbean boys were replacing Jews at Hackney Downs. (fn. 59) The trend continued during the 1970s, the largest new group being of Caribbean and the second largest of Mediterranean origins. Statistics showing that Hackney had, after Brent and Haringey, London's highest percentage of heads of households from the New Commonwealth or Pakistan include Stoke Newington and Shoreditch. The wards with more than 35 per cent, however, were Hackney's central ones from Lea bridge to the southern end of Stoke Newington. In 1981 more than half of the people in immigrant households were aged under 30. (fn. 60)
Industrial decline, most noticeable in the departure of large firms, continued as elsewhere in inner London. Interviews with Hackney families in 1979 revealed 32 per cent to be in poverty, apparently the highest percentage shown in any study; in 1983 there was little difference in the living conditions of natives and immigrants. Local government reorganization was resented, for having created an impersonal authority, which had deprived residents of their sense of neighbourhood. As early as 1972 economies had removed the caretakers from most housing estates; vandalism and neglect had worsened. (fn. 61) Complaints continued through the 1980s, (fn. 62) as improvements were balanced by the need for further savings: Clapton's Lea View flats, whose renovation brought a royal visit in 1986, were again poorly maintained in 1991. (fn. 63) Few tower blocks could be replaced; some were strengthened and some in 1992 stood empty while neighbouring low-rise homes were retained. (fn. 64)
A contradictory trend was the building or refurbishment of houses for the middle class. Gentrification came comparatively late, since Hackney lacked the squares of southern Islington, (fn. 65) while all parts had large council estates; it also suffered from traffic congestion and the absence of Underground stations. (fn. 66) By 1982, however, the national press was drawing attention to desirable terraces, in 1985 professional people were moving in from more expensive suburbs, and in 1987 much of Hackney was seen as a friendlier alternative to Islington; Victoria Park, De Beauvoir Town, Lower Clapton, and some avenues near London Fields proved particularly popular. (fn. 67) Few new sites were available, except on the old fringe of building near the marsh or the Lea, but much restoration continued after the end of the property boom. Patches of desirable housing in conservation areas and extensive public spaces attracted residents.
In 1992 a local task force, funded by the Department of the Environment, was set up to identify needs as part of a programme to revive the economies of the poorest urban areas. Proximity to the City of London, many and varied small businesses, and cultural diversity combined with communal cooperation were seen as Hackney's chief strengths. The council successfully sought funds under the City Challenge scheme, with proposals for development centred on the high road through Shoreditch and Kingsland as far as the railway in Dalston, to form the Dalston City Corridor. (fn. 68)
The population (fn. 69) rose from 12,730 in 1801 to 16,771 in 1811, 22,494 in 1821, 31,047 in 1831, and 37,771 in 1841. Steeper rises followed, to 53,589 in 1851, 76,687 in 1861, (fn. 70) 115,110 in 1871, and 163,681 after the decade of fastest growth in 1881. Further increases brought it to 198,606 in 1891, 219,272 in 1901, and a peak of 222,533 in 1911. From 222,142 in 1921 it fell to 215,333 in 1931, to 171, 342 in 1951, and 164,766 in 1961, the density falling over those 40 years from 68 to 50 persons to an acre. The trend continued after Hackney joined Shoreditch and Stoke Newington, whose total population of 257,522 in 1961 had fallen to give the L.B. 220,279 by 1971 and 180,434 by 1981. In the former Hackney M.B. the fall in the 1970s was 28 per cent in Queensbridge and over 20 per cent in five other wards; it was over 10 per cent elsewhere except in Eastdown, around Hackney Downs, where the rise was 14.4 per cent, and King's Park, where new housing produced a rise of more than 55 per cent. (fn. 71)